Matches
Eloquently sarcastic
- Joined
- Oct 13, 2009
- Messages
- 544
- Reaction score
- 708
- Points
- 93
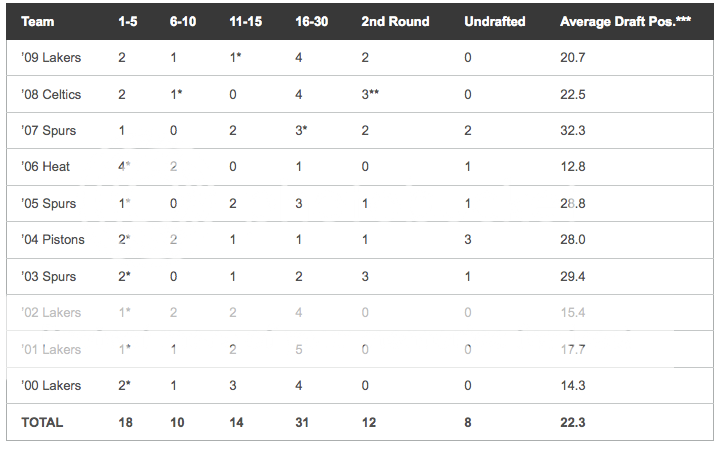
I've been on record here a couple times as steering away from the "blow it up" model, also known as "Look at the Thunder! Let's just do what they did!" I point out the Memphis Grizzlies who had similar W-L records over a similar stretch and instead of coming out with a future MVP and several nice pieces around him like the Thunder, came out with Mike Conley, OJ Mayo and Hasheem Thabeet.
But I thought I should get some hard data on the draft. What is the success rate of picking in various locations? If we tank get a top 4 pick, what's the likelihood of that player becoming an all-NBA talent that we can rebuild the organization around? If we're in the high lottery (1-7), what are the chanced that the guy busts anyway and never even starts more than 80% of his games? How frequently can you get solid players in that 14-20 range? I didn't want to just spout assertions and pull anecdotes. I wanted hard data. And I didn't want to hoard it.
So here it is. (The link is to the company gracious enough to host the image)
Data is from the 1994-2008 drafts (since I could not adequately gauge success rates yet for 2009 or 2010). The criteria are this:
Gray line: Played in 100 NBA games or more, or will break that mark this season, or would have if he had not gotten into a motorcycle accident, or is named Greg Oden. To not succeed here is considered a complete bust.
Green lines: MPG for career. The dark green is players who averaged or have averaged at least 16 mpg, the light green mark is 22 mpg. I chose these figures because I consider that a player who does not average 16 minutes a game must be considered a fringe NBA player and anyone drafted in the lottery who misses that mark is a bust. In the low lottery, even this low mark is only about a 75% proposition. The 22 mpg mark represents for me someone who is at the very least, an important bench contributor.
Red lines: The next tier up in success metrics: percentage of games started. I wanted to see players who were borderline starters (50% or more) and fairly regular starters (80% or more). The scariest stat here is that even drafting #2, you're only slightly above a 60% chance of getting a true NBA starter.
Blue lines: All-stars. Dark blue line is players who've been all-stars at least once. Light blue is players who made All-NBA teams at least once.
My quick takeaways:
Please don't say the draft isn't luck. Once you get outside the top 5, you only have a 50% chance of drafting a guy who's simply a starter. That gives credence to the "Tank Now!" camp. On the other hand, if you do "Tank Now", remember that you only have around a 22% chance of getting the #1 pick, and even if you get it, you're more likely to hit on Red or Black in roulette than getting a truly elite talent. And in the top 4, it's only 46.6% that your pick will make a single all-star game.
That sound you hear is me, in the corner, in the fetal position, crying myself to sleep.
Esoteric note: The graph here does not represent actual percentages. Since 15 years is not a very large sample size, I normalized the graphs to smooth them out a little. The vagaries of why a player was chosen in a specific slot are not as important as the general trend. For example, for whatever reason, players drafted #11 or #12 over this 15-year stretch have been HORRIBLE. It's a litany of suck and you can still see the dip in the graphs. But this graph smooths things out somewhat - for example the data for the #18 spot is actually an average of the actual 18th spot results, the results from 17 thru 19, and the results from 16 thru 20. Since there's nothing particularly special about the #18 slot - a player picked there could have easily been taken a couple spots earlier or later. This is also why the #30 spot jumps up. Because I was lazy and did #31-36 as an aggregate, I couldn't actually to the average of #28-32 for the #30 spot -- shown here is the actual success rate for #30.
 This was a Saturday afternoon and almost all the stats I used were on the lovely draft history pages at basketball-reference.com. To go into each player and lookup their PER would be ... another Saturday.