• Changing RCF's index page, please click on "Forums" to access the forums.

Super Bowl LVI - Ohio vs Odell

Do Not Sell My Personal Information
Were those first couple undercuts an attempt at dislodging the ball? No idea WTF the punches to the head were for. Proper punishment for punching someone's helmet should have been a broken hand for being a fucking moron.
so i agree its too bad he didnt break his hand. But the NFL has pretty strict rules that this is an immediate ejection. You cant throw multiple punches at a player and not expect to be kicked out/suspended.

But once again the NFL really doesnt give a shit, and just enforces its rules dependent on if they want to or not
I mean, this is the same team that had a star player land a flying kick right to our punter's face and wasn't thrown out :chuckle:

ETA: does anyone recall whether or not our punter got flagged for head-butting the sole of Antonio Brown's foot?
 
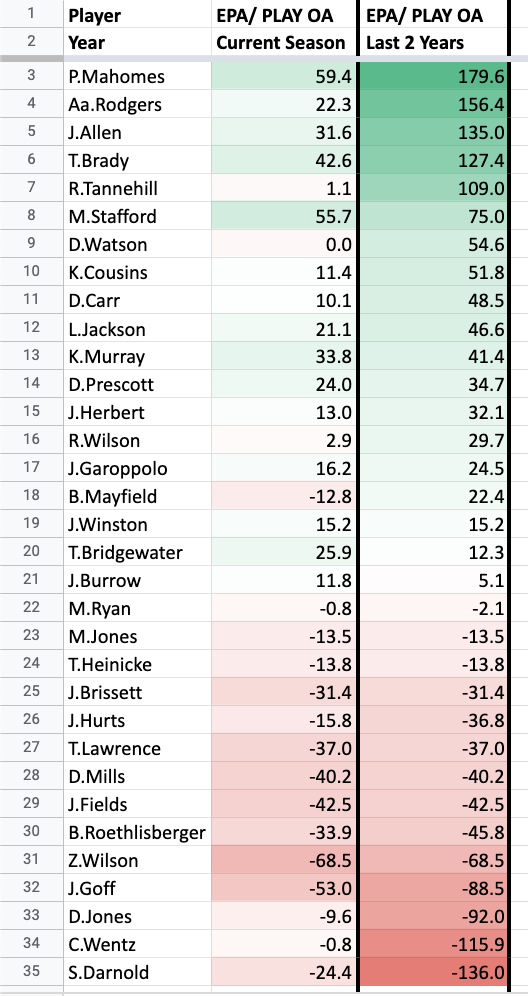
Been working on a few things, which I have posted in the Baker thread but wanted to drop this one here, as it is an interesting look at how the 2 year over average performance has gone at the QB position.

So this is looking at Expected Points Added on a per play basis and looking at how each NFL QB has performed relative to a league average QB. So this is driving towards a value added type statistic. How good is a QB relative to just having an average passer on your team.

The craziest aspect of this stat might be that Watson's 2 year performance over average is still in the top 10 and he hasn't played this year. :chuckle:

In the top group, Tannehill has been the one huge regression QB. Unfortunately, Mayfield has been the second biggest regression QB from the top 20 of the 2 year average. :(

Active QB’s

Screen Shot 2021-10-19 at 4.07.25 PM.png
 
Last edited:
Been working on a few things, which I have posted in the Baker thread but wanted to drop this one here, as it is an interesting look at how the 2 year over average performance has gone at the QB position.

So this is looking at Expected Points Added on a per play basis and looking at how each NFL QB has performed relative to a league average QB. So this is driving towards a value added type statistic. How good is a QB relative to just having an average passer on your team.

The craziest aspect of this stat might be that Watson's 2 year performance over average is still in the top 10 and he hasn't played this year. :chuckle:

In the top group, Tannehill has been the one huge regression QB. Unfortunately, Mayfield has been the second biggest regression QB from the top 20 of the 2 year average. :(

Active QB’s

View attachment 6774
sweet fucking jesus every play Mahomes is expected to add 60 points over the average? over the course of a game ... carry a two... 4500 extra points per game than the average player.

mean while sam Darnold reduces his teams expected points per game by ..... 10000?!?!

me thinks your calculator needs some correction

Over average is a measure of total plays. Possibly confusing language without an explanation.

So these are saying........ relative to a league average QB, how many points is Mahomes adding in total, in the 1585 plays he has logged in the EPA database during that time period.

To see it on a per game basis, it would be his 2 year EPA/Play OA number (179.6) divided by the number of regular season games he has played (21).

So on an EPA/play OA basis......Mahomes is worth 8.55 points more per game than an average QB. Which is a pretty staggering number.

The reason a total aggregate is helpful is because you want players that are actually on the field playing. The more Mahomes plays at a high level, the more he is worth. Which is reflected in the chart above.
 
Last edited:
Derrick Henry has to be the MVP so far right? This is just insane. He's completely carrying that offense with no help at all. Tannehill has been below average, a huge drop off in production from last season.
He's on pace for another 2,000 yard season. Back-to-back. Never been done before in NFL history. It would be cool if he did it.
 
Texans trying really hard to get another team to offer more than whatever the Dolphins already have.


Wouldn't be a bad rental if OBJ and/or Landry have to missed extended time (or if OBJ is traded).

Cooks wouldn't be a bad addition if OBJ and Landry are still here. He's good.
 
Cooks wouldn't be a bad addition if OBJ and Landry are still here. He's good.
I mean, sure but I'm not trading anything of value for Cooks to be our #3 WR for half a season.
 
Cooks wouldn't be a bad addition if OBJ and Landry are still here. He's good.
Would rather focus on involving DPJ more and more as he looked great all preseason and has capitalized on almost every one of his limited targets through the first 6 games.
 
Would rather focus on involving DPJ more and more as he looked great all preseason and has capitalized on almost every one of his limited targets through the first 6 games.

Other than the fumble against the Texans, has he had a negative play/drop yet?
 

Rubber Rim Job Podcast Video

Episode 3-14: "Time for Playoff Vengeance on Mickey"

Rubber Rim Job Podcast Spotify

Episode 3:14: " Time for Playoff Vengeance on Mickey."
Top