- Joined
- Sep 1, 2006
- Messages
- 10,306
- Reaction score
- 23,670
- Points
- 135
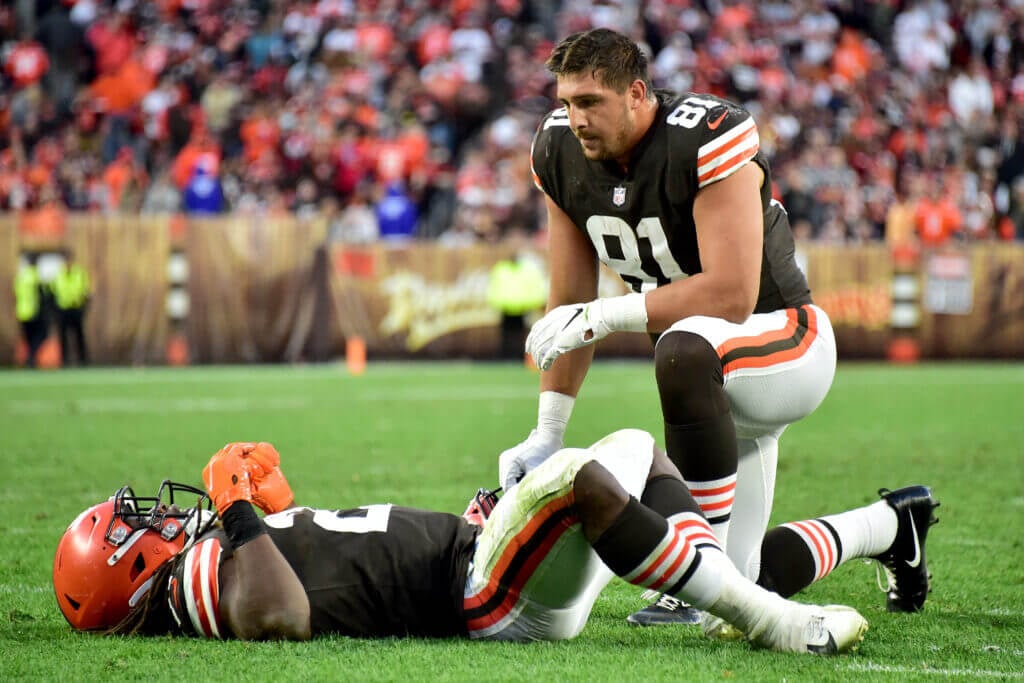
Browns rewind: Loss to Cardinals was bad, and it could have been a lot worse
Cleveland was throttled from top to bottom and now faces a Thursday night matchup with injury concerns all over the field.
....When the Browns went for it on fourth-and-4, they had just six blockers against a seven-man blitz. Once Mayfield didn’t see anyone open initially, he was stuck in the pocket as Jordan Hicks closed in on him for the sack. That’s four times in the last four games that the Browns have been sacked on a fourth-down play; they’re 3-of-11 in converting those fourth downs.
On those fourth-down failures, Kevin Stefanski said Monday: “I really believe we have to call better plays and we have to execute better. In those moments when we are going for it, I have to make sure I give the guys something they can execute and something (where) we can get the ball out of our hands on time.
....
The Cardinals simply dared the Browns to throw on them. “They just ran a 6-2 defense,” Browns guard Joel Bitonio said. “It’s hard to run against a 6-2 defense, and that’s why you saw us passing the ball early in the game. ... for a team to run 6-2 for a majority of the snaps, they really want to take away one aspect of your game, the run game.”
After Sunday’s game, Stefanski said the Browns started the game with empty backfields to try to take advantage of the Cardinals stacking the box. “They were in some big personnel, so there were some advantageous looks we felt to spread them out,” he said.
....
In the second quarter versus the Cardinals, it appeared the Browns might have had a chunk play when a Hunt run to the left looked like it was supposed to be a reverse to Odell Beckham Jr. coming back to the right. Hunt kept it instead, and Bitonio’s reaction after the play indicated that another handoff was supposed to take place.
Asked about that Monday, Stefanski said, “I really do not want to get into the specifics of those types of things, respectfully. There are a bunch of different things and a bunch of different things I wish I did differently, and we can clean those things up.”


