• Changing RCF's index page, please click on "Forums" to access the forums.

2020 NBA Draft

Do Not Sell My Personal Information
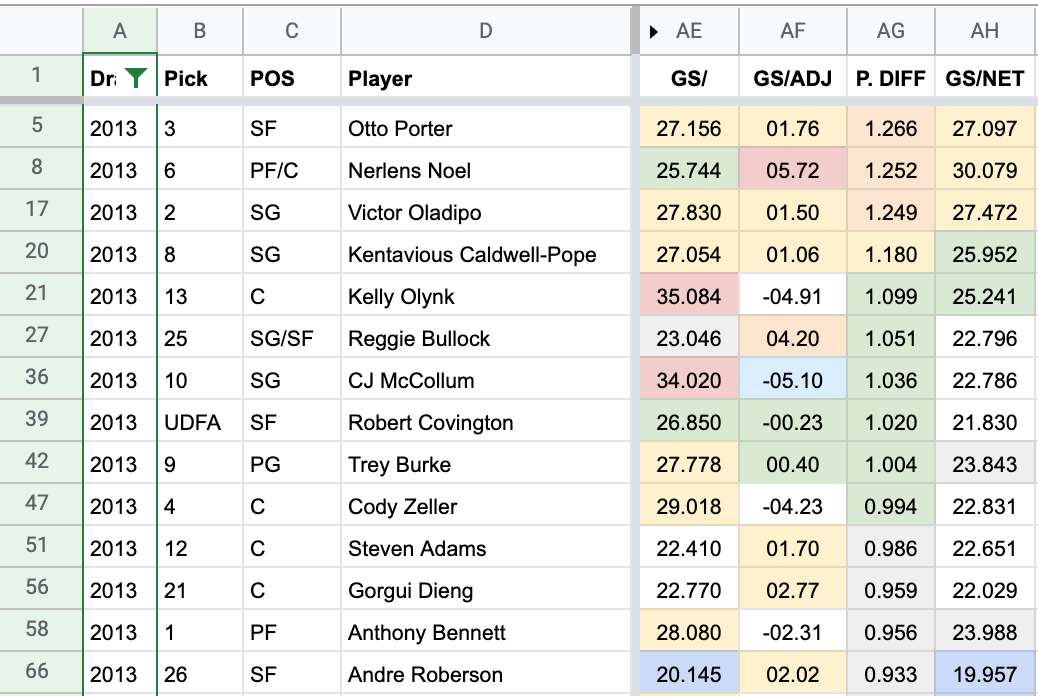
Just for the sake of it, here is another look at past 15 years' draft.

What was your thought on the bucketing here? Can you speak to, for example, why the ranges are 1-3, 4-10, 11-20, etc.?

Since 2004.......my math saw:

#1 pick has produced 8 All-Stars
#2 pick has produced 3 All-Stars
#3 pick has produced 6 All-Stars
#4 pick has produced 3 All-Stars
#5 pick has produced 3 All-Stars
#6 pick has produced 2 All-Stars
#7 pick has produced 2 All-Stars
#8 pick has produced 0 All-Stars
#9 pick has produced 6 All-Stars
#10 pick has produced 3 All-Stars
#11 pick has produced 1 All-Stars
#12 pick has produced 0 All-Stars
#13 pick has produced 2 All-Stars
#14 pick has produced 1 All-Stars

It is fine if a player is a good pick........but not all good picks are created equal.......and while Giannis' happen......the easiest route to an All-Star is still having a top pick.

The lottery has produced 40 All-Stars since 2004.......58% of them came from top top 5, which is only representative of 35% of the lottery selections. 32% of them came from picks 6-10, which is again, representative of 35% of the lottery selections. The last 10% came from picks 11-14, which is representative of 30% of the lottery selections.

1-5: 58%
6-10: 32%
11-14: 10%

That is such a steep, steep drop when bucketing the picks at top of the top 10, bottom of the top 10 and remaining lotto. Especially when considering these 11-14 numbers ballooned recently with Booker, Bam and Mitchell.

There are certainly players who beat the odds......but when nearly 2/3 of the All-Stars come from the top 5 picks vs 6-14, that is such a massive gap statistically......especially when you consider that picks 6-14 represents a pool of nearly twice as many players (80 selections in the top 5, 144 in picks 6-14) . So even with that large difference in quantity, it still produces a large value gap in the number of good, available players outside the top 5.
 
Last edited:
What was your thought on the bucketing here? Can you speak to, for example, why the ranges are 1-3, 4-10, 11-20, etc.?

Since 2004.......my math saw:

#1 pick has produced 8 All-Stars
#2 pick has produced 3 All-Stars
#3 pick has produced 6 All-Stars
#4 pick has produced 3 All-Stars
#5 pick has produced 3 All-Stars
#6 pick has produced 2 All-Stars
#7 pick has produced 2 All-Stars
#8 pick has produced 0 All-Stars
#9 pick has produced 6 All-Stars
#10 pick has produced 3 All-Stars
#11 pick has produced 1 All-Stars
#12 pick has produced 0 All-Stars
#13 pick has produced 2 All-Stars
#14 pick has produced 1 All-Stars

It is fine if a player is a good pick........but not all good picks are created equal.......and while Giannis' happen......the easiest route to an All-Star is still having a top pick.

The lottery has produced 40 All-Stars since 2004.......58% of them came from top top 5, which is only representative of 35% of the lottery selections. 32% of them came from picks 6-10, which is again, representative of 35% of the lottery selections. The last 10% came from picks 11-14, which is representative of 30% of the lottery selections.

1-5: 58%
6-10: 32%
11-14: 10%

That is such a steep, steep drop when bucketing the picks at top of the top 10, bottom of the top 10 and remaining lotto. Especially when considering these 11-14 numbers ballooned recently with Booker, Bam and Mitchell.

There are certainly players who beat the odds......but when nearly 2/3 of the All-Stars come from the top 5 picks vs 6-14, that is such a massive gap statistically......especially when you consider that picks 6-14 represents a pool of nearly twice as many players (80 selections in the top 5, 144 in picks 6-14) . So even with that large difference in quantity, it still produces a large value gap in the number of good, available players outside the top 5.

Interesting! That's real good analysis.

Here are my two more cents.

Since you are talking about lottery picks. Over the last 15 years of drafts, 42 lottery picks (you have 40 - may be I need to re-check and edit) and 20 non-lottery picks have become all-stars. This is not an argument for/against anything - just found it interesting.
We can also look from one interesting perspective - whether a pick became an all-star playing for his first team or after being traded. That might indicate that even though the player was good, the pick was not (may be he was not a good fit in the team/system ....).
Although there are no optimal way of evaluating a player, picking only all-stars exclude such fine players as Tobias Harris, Eric Bledsoe, Whiteside, Rubio, Batum, Gallinari, Lou Williams etc.

Btw, I bucketed by 10 except for the top 10. Just that "Top three" is so oft-used, I made that a separate bucket.
I posted the raw data so that anyone can play with the data, and not just take my buckets for granted :devilish:
 
What was your thought on the bucketing here? Can you speak to, for example, why the ranges are 1-3, 4-10, 11-20, etc.?

Since 2004.......my math saw:

#1 pick has produced 8 All-Stars
#2 pick has produced 3 All-Stars
#3 pick has produced 6 All-Stars
#4 pick has produced 3 All-Stars
#5 pick has produced 3 All-Stars
#6 pick has produced 2 All-Stars
#7 pick has produced 2 All-Stars
#8 pick has produced 0 All-Stars
#9 pick has produced 6 All-Stars
#10 pick has produced 3 All-Stars
#11 pick has produced 1 All-Stars
#12 pick has produced 0 All-Stars
#13 pick has produced 2 All-Stars
#14 pick has produced 1 All-Stars

It is fine if a player is a good pick........but not all good picks are created equal.......and while Giannis' happen......the easiest route to an All-Star is still having a top pick.

The lottery has produced 40 All-Stars since 2004.......58% of them came from top top 5, which is only representative of 35% of the lottery selections. 32% of them came from picks 6-10, which is again, representative of 35% of the lottery selections. The last 10% came from picks 11-14, which is representative of 30% of the lottery selections.

1-5: 58%
6-10: 32%
11-14: 10%

That is such a steep, steep drop when bucketing the picks at top of the top 10, bottom of the top 10 and remaining lotto. Especially when considering these 11-14 numbers ballooned recently with Booker, Bam and Mitchell.

There are certainly players who beat the odds......but when nearly 2/3 of the All-Stars come from the top 5 picks vs 6-14, that is such a massive gap statistically......especially when you consider that picks 6-14 represents a pool of nearly twice as many players (80 selections in the top 5, 144 in picks 6-14) . So even with that large difference in quantity, it still produces a large value gap in the number of good, available players outside the top 5.

I don't disagree with this. However, routinely these "weak drafts" are anything but and still have the same top players, they are just harder to identify.
 
Super interesting to me that Larry has the 4th highest VORP from the 2015 draft. He's above guys like KP, DLo, Booker. Would never have guessed.
 
Super interesting to me that Larry has the 4th highest VORP from the 2015 draft. He's above guys like KP, DLo, Booker. Would never have guessed.

Yeah, kinda odd. But of all the adv stats, I found VoRP to be the most telling - though not perfect
 
I don't disagree with this. However, routinely these "weak drafts" are anything but and still have the same top players, they are just harder to identify.

I may be a contrarian but I think it is actually easier to identify who should be drafted in "bad" years.......because there tends to so few guys who stand out.

Like in Anthony Bennett's year, a not even moderately complex model pegged these guys as the 14 most likely to succeed.

Screen-Shot-2020-09-03-at-1-36-53-PM.png


The head scratching thing to me though is teams seem to not be universally applying some just basic litmus tests like this.

Like, how is it even possible that the Cavs could have taken Bennett #1 overall seeing the profiles of Oladipo and Porter. Noel I get, his frame and injury just flagged him. But additionally, there are so many plus profiles on this list that were ignored by teams for somewhat unknown reasons (Covington is the real one screaming at everyone analytically.......and he wasn't even drafted).

The above isn't even meant to prove anything......just to show that with a not even moderately complex model, you can narrow the possible choices pretty considerably. Is it always right? I mean no but in bad drafts, the guys who are most likely to survive stand out even more. In this "bad" 2013 draft, a model selected 9 of the eventual 10 top VORP collegiate players in its' top 14. The only one missing was Plumlee. Scouting is not always this easy but it does go to show how much bias' tend to cloud teams' judgement in a lot of cases.......where they ignore a lot of the data that is available and bet on things that are less tangible.

My argument has always been that finding players who will succeed (at a much higher rate) is not an impossible exercise but for guys in the NBA, with expertise and lifetime of knowledge, it many times, is hard to get through to those people. I experienced this first hand with a lot of the coaches and scouts I worked with, when I was a lead product person working with NBA teams on initiatives like scouting and video analysis. It was amazing how you could show a coach a graphic like the above and their answer would be something to the effect of "I know what an NBA player looks like". We did exercises all the time where we would rank sort profiles and it was amazing how poorly some scouts did relative to simple models.......and it is clear which teams have caught on to this too, just based on their success relative to their draft position.
 
HoopsHype updated their aggregate mock; some notable changes since July:

Lottery: Toppin and Avdija jump ahead of Okongwu, who falls to 6th. Haliburton rises to 7th, swapping with Hayes who falls to 9th. Nesmith and Patrick Williams both move up 2 spots, to 11th and 12th respectively, and Saddiq Bey rises all the way from 19th to 13th. Achiuwa slides a couple spots to 14th, and Anthony slips out of the lottery from 11th to 15th.

First round: Jalen Smith rises from 25th to 20th, and Pokusevski rises from 28th to 22nd. Three players rise into the top-30: Tyrell Terry going from 32nd to 23rd, Leandro Bolmaro going from 31st to 25th, and Desmond Bane going all the way from 47th to 29th. Mannion slides 5 spots to 28th, Carey, Nnaji, and Dotson slip out of the first round to 32nd, 34th, and 36th respectively.

Second round: Malachi Flynn jumps 11 spots to 33rd, and Tillman jumps 14 spots to 35th. Isaiah Joe appears at 44th and Petrusev appears at 53rd after being unranked. Sam Merrill jumps from 80th to 56th. Cassius Stanley slides from 33rd to 41st, Reed slides from 37th to 45th, Quickley slides from 38th to 47th, and Perry slides from 40th to 50th.

I updated my board to account for these changes, and also to add a few more guys I ran my draft rater on (all in Tier 5).


Tier 1
1. LaMelo Ball

Tier 2a
2. Tyrese Haliburton

Tier 2b
3. Onyeka Okongwu
4. Killian Hayes
5. Anthony Edwards
6. James Wiseman
7. Aleksej Pokusevski

Tier 3
8. Devin Vassell
9. Josh Green
10. Malachi Flynn
11. Tre Jones
13. RJ Hampton
14. Nate Hinton

Tier 4
15. Deni Avdija
16. Isaac Okoro
17. Xavier Tillman
18. Theo Maledon
19. Vernon Carey
20. Obi Toppin
21. Reggie Perry
22. Leandro Bolmaro
23. Devon Dotson
24. Trevelin Queen
25. Nico Mannion
26. Jalen Smith
27. Patrick Williams
28. Paul Reed
29. Kira Lewis Jr.
30. Desmond Bane

Tier 5

31. Mason Jones
32. Jahmi'us Ramsey
33. Saddiq Bey
34. Marko Simonovic
35. CJ Elleby
36. Payton Pritchard
37. Killian Tillie
38. Kaleb Wesson
39. Paul Eboua
40. Nathan Knight
41. Lamine Diane
42. Vit Krejci
43. Aaron Nesmith
44. Filip Petrusev
45. Tyrell Terry
46. Daniel Oturu
47. Zeke Nnaji
48. Jalen Harris
49. Ashton Hagans
50. Yoeli Childs
51. Tres Tinkle
52. Grant Riller
53. Markus Howard
54. Yam Madar
55. Isaiah Stewart
56. Austin Wiley
57. Saben Lee
58. Ty-Shon Alexander
59. Sam Merrill
60. Rokas Jokubaitis
 
Last edited:
HoopsHype updated their aggregate mock; some notable changes since July:

Lottery: Toppin and Avdija jump ahead of Okongwu, who falls to 6th. Haliburton rises to 7th, swapping with Hayes who falls to 9th. Nesmith and Patrick Williams both move up 2 spots, to 11th and 12th respectively, and Saddiq Bey rises all the way from 19th to 13th. Achiuwa slides a couple spots to 14th, and Anthony slips out of the lottery from 11th to 15th.

First round: Jalen Smith rises from 25th to 20th, and Pokusevski rises from 28th to 22nd. Three players rise into the top-30: Tyrell Terry going from 32nd to 23rd, Leandro Bolmaro going from 31st to 25th, and Desmond Bane going all the way from 47th to 29th. Mannion slides 5 spots to 28th, Carey, Nnaji, and Dotson slip out of the first round to 32nd, 34th, and 36th respectively.

Second round: Malachi Flynn jumps 11 spots to 33rd, and Tillman jumps 14 spots to 35th. Isaiah Joe appears at 44th and Petrusev appears at 53rd after being unranked. Sam Merrill jumps from 80th to 56th. Cassius Stanley slides from 33rd to 41st, Reed slides from 37th to 45th, Quickley slides from 38th to 47th, and Perry slides from 40th to 50th.

I updated my board to account for these changes, and also to add a few more guys I ran my draft rater on (all in Tier 5).

Man, my stuff really dislikes Williams. :chuckle: Nice to see Bey getting some love though.

Also, Flynn hype train for sure. We talked about him earlier in the year and he was one of the standout guys I saw, relative to his projected draft position. I'm curious to see if he sneaks in to the back of the 1st when it is all said and done.

I will remain on the Reed bandwagon. That guy will make some GM (most likely David Griffin) look really smart in the second, if he indeed slides there. I'm just staring at NO having picks 39 and 42........and drafting something like Reed and Tillman / Bey......and everyone wondering how they have an entire roster of switchy guys 3 years from now.
 
Last edited:
Man, my stuff really dislikes Williams. :chuckle: Nice to see Bey getting some love though.

Also, Flynn hype train for sure. We talked about him earlier in the year and he was one of the standout guys I saw, relative to his projected draft position. I'm curious to see if he sneaks in to the back of the 1st when it is all said and done.

My draft rater also dislikes Williams. It's lukewarm on Bey...his rebound/steal/block numbers are pretty meh. What's the deal there? Decent enough physical tools, but apparently doesn't use them to great effect on either end of the court.

And yeah, I continue to be very high on Flynn. As I've mentioned before, when a PG wins conference DPOY you have to pay attention. That toughness is what makes some non-elite guards stand out from the crowd and earn rotation spots.
 
I may be a contrarian but I think it is actually easier to identify who should be drafted in "bad" years.......because there tends to so few guys who stand out.

Like in Anthony Bennett's year, a not even moderately complex model pegged these guys as the 14 most likely to succeed.

Screen-Shot-2020-09-03-at-1-36-53-PM.png


The head scratching thing to me though is teams seem to not be universally applying some just basic litmus tests like this.

Like, how is it even possible that the Cavs could have taken Bennett #1 overall seeing the profiles of Oladipo and Porter. Noel I get, his frame and injury just flagged him. But additionally, there are so many plus profiles on this list that were ignored by teams for somewhat unknown reasons (Covington is the real one screaming at everyone analytically.......and he wasn't even drafted).

The above isn't even meant to prove anything......just to show that with a not even moderately complex model, you can narrow the possible choices pretty considerably. Is it always right? I mean no but in bad drafts, the guys who are most likely to survive stand out even more. In this "bad" 2013 draft, a model selected 9 of the eventual 10 top VORP collegiate players in its' top 14. The only one missing was Plumlee. Scouting is not always this easy but it does go to show how much bias' tend to cloud teams' judgement in a lot of cases.......where they ignore a lot of the data that is available and bet on things that are less tangible.

My argument has always been that finding players who will succeed (at a much higher rate) is not an impossible exercise but for guys in the NBA, with expertise and lifetime of knowledge, it many times, is hard to get through to those people. I experienced this first hand with a lot of the coaches and scouts I worked with, when I was a lead product person working with NBA teams on initiatives like scouting and video analysis. It was amazing how you could show a coach a graphic like the above and their answer would be something to the effect of "I know what an NBA player looks like". We did exercises all the time where we would rank sort profiles and it was amazing how poorly some scouts did relative to simple models.......and it is clear which teams have caught on to this too, just based on their success relative to their draft position.

The 2 best players from that draft don't appear here.
 
My draft rater also dislikes Williams. It's lukewarm on Bey...his rebound/steal/block numbers are pretty meh. What's the deal there? Decent enough physical tools, but apparently doesn't use them to great effect on either end of the court.

I hopefully don't talk about this too much :chuckle: but the huge analytical hole I see, is the evaluation of NBA SF's at the college level. Their overall impact is really suppressed at the college level......but Bey looks eerily similar to a Tatum type. They obviously have differences but their more standout skills were above average scoring efficiency for wing prospects, combined with above average assist generation. They also got above the average prospect bar at the SF position, which is actually not very common.......even less common for guys who actually have small forward size.

In my database, only 36 prospects that were labeled as SG/SF, SF or SF/PF got above that average prospect threshold. Of that 36, only 24 went on to play the 3. Out of that group of 24, the guys who had the size and skill to play the 3, the success rate was incredibly high. Subjectively speaking, 14-18 are + average or better NBA players, depending on your definition. A variety of draft slots landed there too.......Durant (duh) but then also guys like Warren, Kawhi, Crowder, George, etc......lots of guys who out kicked their draft slot.

I think that is why Bey is worth at least digging deep on and paying attention to. On average, we are only talking about 2-3 ish guys per draft that have the size and analytical profile to actually become a true NBA 3......and this year, Bey appears to be one of them.
 
Last edited:
The 2 best players from that draft don't appear here.

Sure. My calculation needs per 100 possession data, as it is an attempt to look at impact over the same number of plays.......it has gotten better the last 2 years here but that was not readily available back when Giannis and Gobert were playing. So all the data I have is mainly american college players.......but it does have data on guys like Ball this year, as it is easier to obtain.
 
What was your thought on the bucketing here? Can you speak to, for example, why the ranges are 1-3, 4-10, 11-20, etc.?

Since 2004.......my math saw:

#1 pick has produced 8 All-Stars
#2 pick has produced 3 All-Stars
#3 pick has produced 6 All-Stars
#4 pick has produced 3 All-Stars
#5 pick has produced 3 All-Stars
#6 pick has produced 2 All-Stars
#7 pick has produced 2 All-Stars
#8 pick has produced 0 All-Stars
#9 pick has produced 6 All-Stars
#10 pick has produced 3 All-Stars
#11 pick has produced 1 All-Stars
#12 pick has produced 0 All-Stars
#13 pick has produced 2 All-Stars
#14 pick has produced 1 All-Stars

Regarding the #8 pick, I was surprised when it had zero All-Stars... and I thought, wasn't Andre Miller a #8... but then I see your chart is since 2004 AND.... very surprising to my aging mind... Andre Miller was never an All-Star. Huh. Who knew.

Oh, and just another point to screw up your chart.... ANOTHER #8 pick for the Cleveland Cavs who SHOULD'VE been an all-star (with a non capitalized A)..... #52 Desagana Diop. Boom.

Oh, and another #8 who would've helped us win our FIRST championship vs Michael Jordan and the Jordanettes... my favorite Cav... Ron Harper. (Why, why? did you trade him....? WHHHYYYYY???)

Yeah, 2004 was a somewhat arbitrary cut off.......LeBron is bucking that trend but guys like Wade are gone......so the current crop of players tends to be the generation just after LeBron.......but yes, it is super odd #8 is just hanging out there.
 
I hopefully don't talk about this too much :chuckle: but the huge analytical hole I see, is the evaluation of NBA SF's at the college level. Their overall impact is really suppressed at the college level......but Bey looks eerily similar to a Tatum type. They obviously have differences but their more standout skills were above average scoring efficiency for wing prospects, combined with above average assist generation. They also got above the average prospect bar at the SF position, which is actually not very common.......even less common for guys who actually have small forward size.

In my database, only 36 prospects that were labeled as SG/SF, SF or SF/PF got above that average prospect threshold. Of that 36, only 24 went on to play the 3. Out of that group of 24, the guys who had the size and skill to play the 3, the success rate was incredibly high. Subjectively speaking, 14-18 are good average or better NBA players, depending on your definition. A variety of draft slots landed there too.......Durant (duh) but then also guys like Warren, Kawhi, Ceowder, George, etc......lots of guys who out kicked their draft slot.

I think that is why Bey is worth at least digging deep on and paying attention to. On average, we are only talking about 2-3 ish guys per draft that have the size and analytical profile to actually become a true NBA 3......and this year, Bey appears to be one of them.

He's tall, but is the size functional? 8.3 rebounds and 0.7 blocks per 100 are SG numbers, not SF numbers (e.g. compare to 12.6 boards, 2.0 blocks per 100 for Tatum). And it's not like Villanova had hulking bigs hoovering up all the boards either. He seems Cedi Osman-y, where he has prototypical wing measurables, but in reality he plays more like a tall SG than a true wing.
 

Rubber Rim Job Podcast Video

Episode 3-15: "Cavs Survive and Advance"

Rubber Rim Job Podcast Spotify

Episode 3:15: Cavs Survive and Advance
Top