I'mWithDan
"Straight Cash Homie"
- Joined
- Jul 21, 2010
- Messages
- 11,838
- Reaction score
- 23,874
- Points
- 135
I also downloaded all of 538's RAPTOR data to see things like possession era WAR performance.
Here was the result to date (Drafts 2011-2021).
I list Median a lot here and I think this is a good illustration of the manifestation of bucketing.
So, PDIFF as a number isn't going to be predictive of exact performance......as noted above......simply the number itself has a moderately positive correlation. Meaning.......if one player has a (1.0) PDIFF and one has a (1.1) PDIFF......there is a moderately positive chance the 1.1 player will be more productive. But this isn't predictive, which I have stressed before, leaves room for qualitative measures as well.
Where this bucketing can be really valuable is narrowing the pool though, which a lot of this 538 data shows.
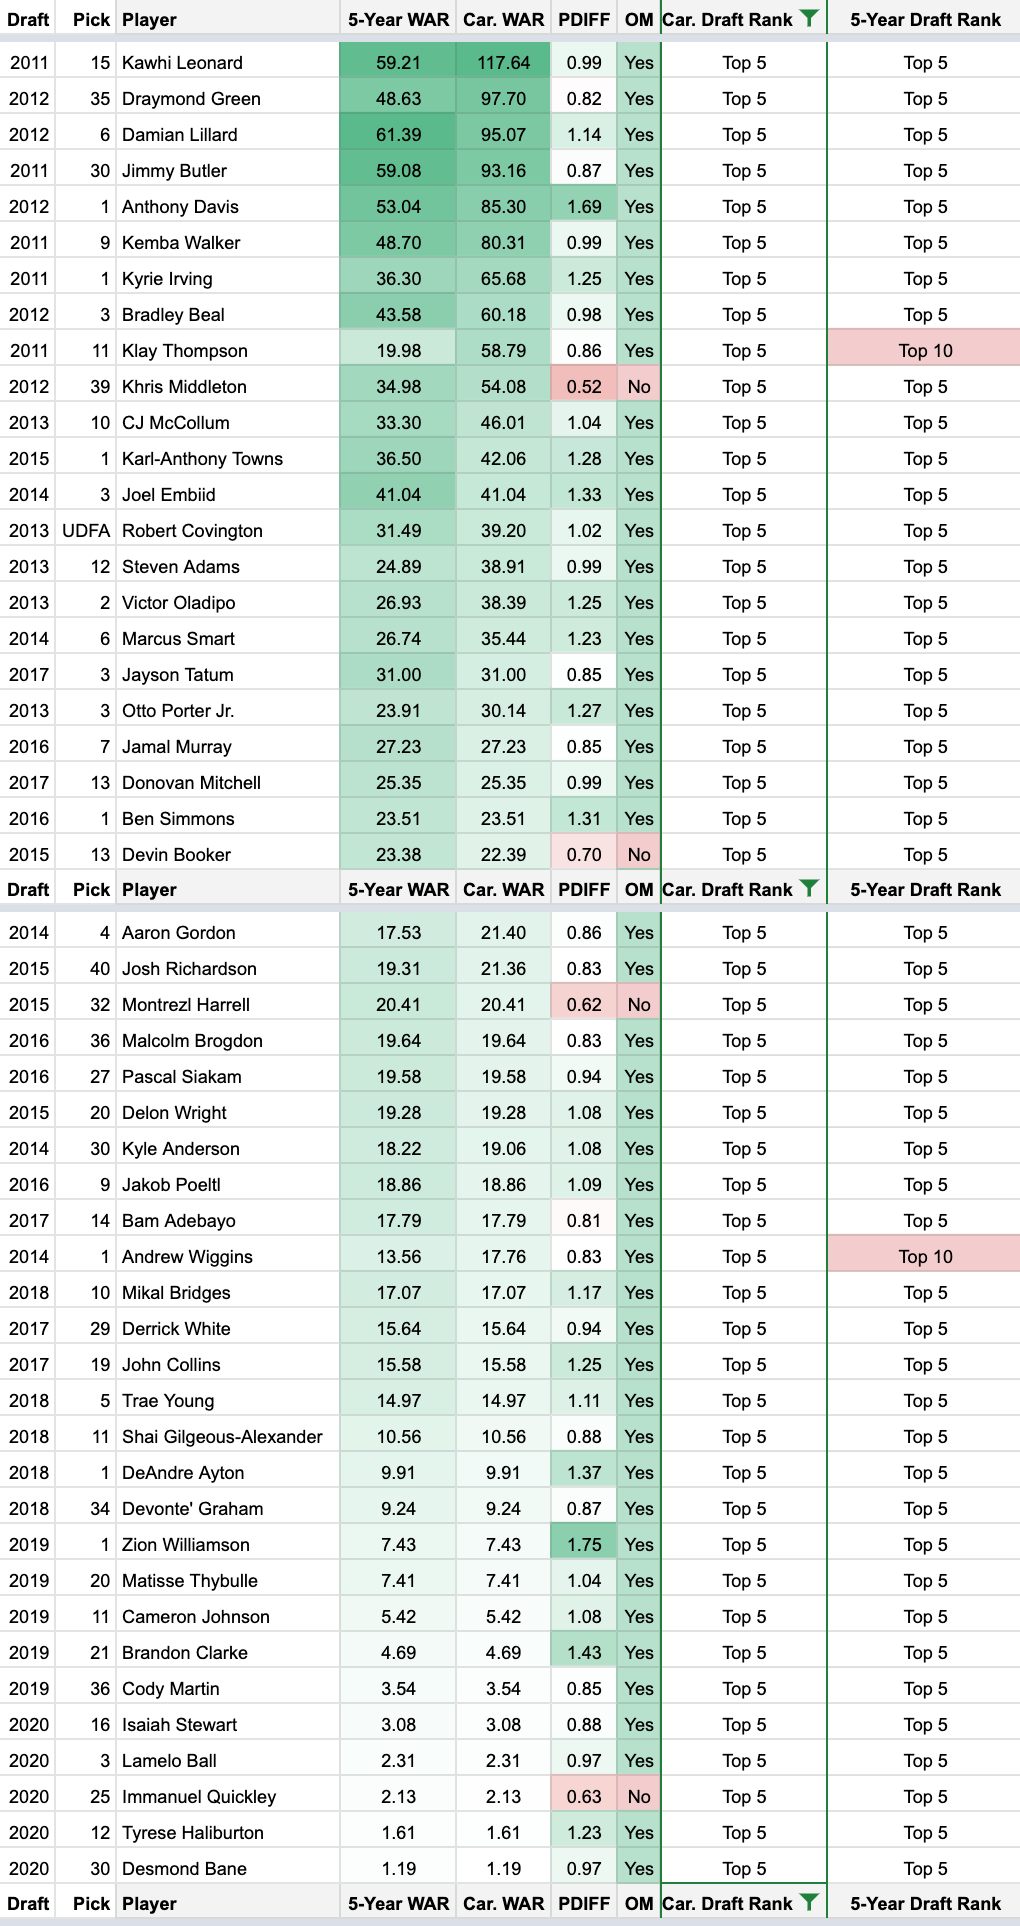
Draft Ranks 2011-2020
PDIFF = Positional Difference Over Median
Top 5 in career WAR from draft - 92% of these players had a PDIFF / OM (.800 or higher).
Top 10 in career WAR from draft - 86% of these players had a PDIFF / OM (.800 or higher).
This isn't merely an exercise in every top or lottery pick being in these top 5 or top 10 data sets either.
Median Top 5 player draft slot: 12
Median top 10 player drat slot: 20
So half of the top 10 WAR players in this data set get picked after the 20th pick. Kind of a crazy number.
PDIFF / OM (.800 or higher) hit rate on top 10 WAR, players regardless of draft position- 86/247 (34.8%)
PDIFF / UM (.799 or lower) hit rate on top 10 WAR, players regardless of draft position- 14/243 (5.7%)
Top 5 draft pool performance based on career WAR, from 538.
This pool does not include a handful of older Euro players like Giannis, Jokic, etc., as they did not have possession data resources when I collected these. Still trying to track them down but recent Euro / G-League players have had data and there seems to be a similar correlation between over median performance, as guys like Ball, Sengun, Green, etc. all performed well in this metric too. Will be interesting to see if that holds moving forward.
This table also shows Career WAR (Car. WAR) and 5-year WAR (last 5 seasons). Guys like Klay (injury) and Wiggins (performance of other draft peers) have dropped them out of the more near term 5 year look, which is noted in the 5-Year Draft Rank column.
Then looking at a breakdown of how these picks fall in each round.
Here is a look at 2011-2016......drafts that now have 5 years or more of WAR data.
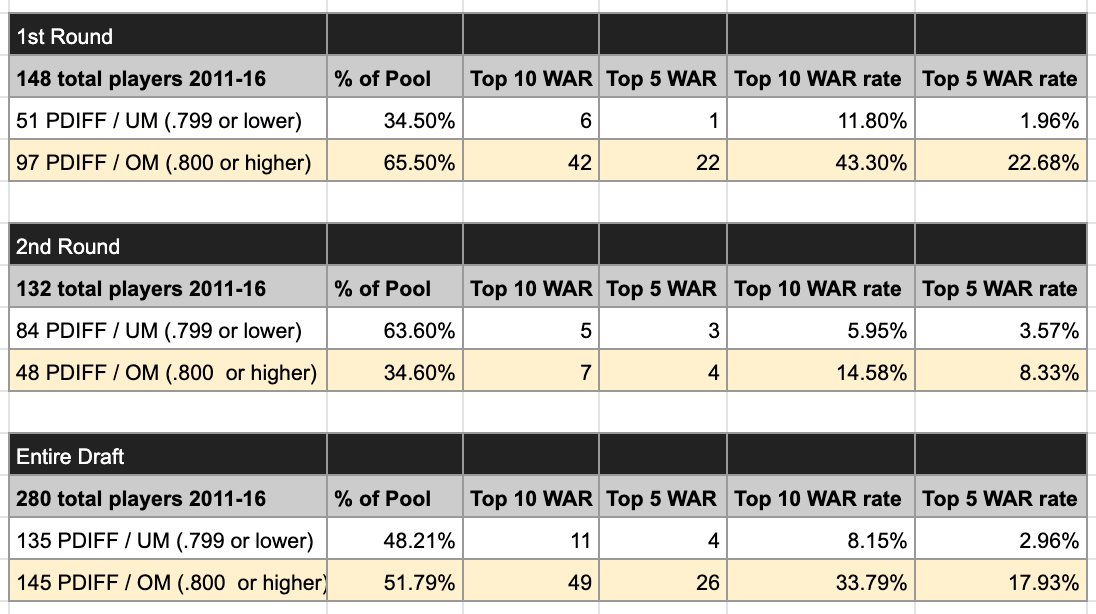
You can see how far more over Median players are selected in the 1st round, which makes sense. More productive players go higher. Then in the second, less productive players go and by a higher percentage. But even seeing this, look at the WAR rates on these selections. In each round, on a percentage basis, the over median players just VASTLY out perform the under median players. Probably underscores that teams' should value production even more than they do.
Definitely cool to have 538 make this data publicly available, to see how something like possession models match up here.
Here was the result to date (Drafts 2011-2021).
I list Median a lot here and I think this is a good illustration of the manifestation of bucketing.
So, PDIFF as a number isn't going to be predictive of exact performance......as noted above......simply the number itself has a moderately positive correlation. Meaning.......if one player has a (1.0) PDIFF and one has a (1.1) PDIFF......there is a moderately positive chance the 1.1 player will be more productive. But this isn't predictive, which I have stressed before, leaves room for qualitative measures as well.
Where this bucketing can be really valuable is narrowing the pool though, which a lot of this 538 data shows.
Draft Ranks 2011-2020
PDIFF = Positional Difference Over Median
Top 5 in career WAR from draft - 92% of these players had a PDIFF / OM (.800 or higher).
Top 10 in career WAR from draft - 86% of these players had a PDIFF / OM (.800 or higher).
This isn't merely an exercise in every top or lottery pick being in these top 5 or top 10 data sets either.
Median Top 5 player draft slot: 12
Median top 10 player drat slot: 20
So half of the top 10 WAR players in this data set get picked after the 20th pick. Kind of a crazy number.
PDIFF / OM (.800 or higher) hit rate on top 10 WAR, players regardless of draft position- 86/247 (34.8%)
PDIFF / UM (.799 or lower) hit rate on top 10 WAR, players regardless of draft position- 14/243 (5.7%)
Top 5 draft pool performance based on career WAR, from 538.
This pool does not include a handful of older Euro players like Giannis, Jokic, etc., as they did not have possession data resources when I collected these. Still trying to track them down but recent Euro / G-League players have had data and there seems to be a similar correlation between over median performance, as guys like Ball, Sengun, Green, etc. all performed well in this metric too. Will be interesting to see if that holds moving forward.
This table also shows Career WAR (Car. WAR) and 5-year WAR (last 5 seasons). Guys like Klay (injury) and Wiggins (performance of other draft peers) have dropped them out of the more near term 5 year look, which is noted in the 5-Year Draft Rank column.
Then looking at a breakdown of how these picks fall in each round.
Here is a look at 2011-2016......drafts that now have 5 years or more of WAR data.
You can see how far more over Median players are selected in the 1st round, which makes sense. More productive players go higher. Then in the second, less productive players go and by a higher percentage. But even seeing this, look at the WAR rates on these selections. In each round, on a percentage basis, the over median players just VASTLY out perform the under median players. Probably underscores that teams' should value production even more than they do.
Definitely cool to have 538 make this data publicly available, to see how something like possession models match up here.
Last edited: